Aug 132015
 

What reasons are given for the failure and insolvency of non-corporate businesses, i.e., those owned by individuals as sole traders or in partnership? Is there any alignment between the reasons given for non-corporate business failures and the reasons given for corporate failures? And where a non-corporate (aka personal) business  insolvency has been brought about by the phoenix scheme of a corporate customer or client, is this made known to the regulator for statistical purposes?

This article is an extension of the discussion in my post  “Confusing causes of corporate insolvency”. Continue reading »

Jan 242014
 

A Federal Government report on compliance by insolvency practitioners who work in the field of personal bankruptcy and insolvency, and are governed under the Bankruptcy Act 1966, was released on 16 January 2014. The 29 page report, published by Australian Financial Security Authority (AFSA), is titled

“Personal insolvency practitioners compliance report 2012-13”.

The phrase “personal insolvency practitioners” refers to Registered Trustees in Bankruptcy and Registered Debt Agreement Administrators.

A list of the CONTENTS is published below. For a copy of the report (PDF) CLICK HERE.

AFSA_contents_1

AFSA_contents_2

Insolvency statistics: Reports to corporate regulator by liquidators: trend in insolvency deficiencies

 ASIC, Corporate Insolvency, Insolvency practices, Insolvency Statistics, Regulation  Comments Off on Insolvency statistics: Reports to corporate regulator by liquidators: trend in insolvency deficiencies
Nov 252013
 

This chart, prepared exclusively for this blog, shows the trend in the number of Schedule B investigation reports filed with the Australian Securities and Investments Commission (ASIC) by external administrators of insolvent corporations from 2007/08 to 2012/13 and the trend in the estimated minimum deficiency that all these corporations, taken together, are said to have incurred.

The primary data has been published by ASIC in annual reports titled, “Insolvency statistics: External administrators’ reports”. 


Chart-ScheduleB-Reports-ASIC-Deficiencies_small

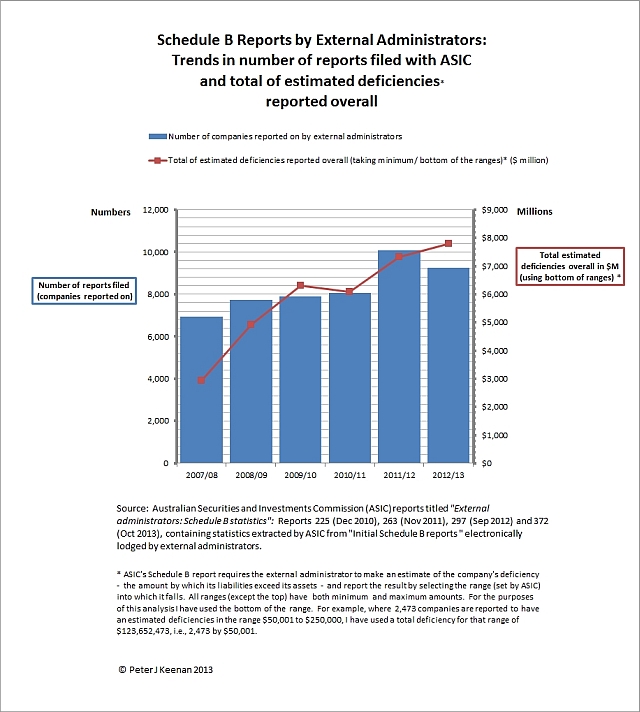
My analysis shows that during 2012/13 the external administrators who filed Schedule B reports electronically reported deficiencies which, taken together, total an estimated minimum of $7.8 billion spread over 9,254 companies. This compares with deficiencies totalling at least $7.3 billion spread over 10,074 companies in 2011/12, and deficiencies totalling at least $6.1 billion spread over 8,054 companies in 2010/11.  A deficiency is the amount by which liabilities owing by a company exceeds the value of its assets.  In other words, it is the amount that creditors are expected to lose.

When completing the initial external administrator report (Schedule B), the external administrator selects from a predetermined set of options for qualitative questions, and ranges for quantitative questions. There are over 30 questions on the form.

One of those questions requires the external administrator to make an estimate of the company’s deficiency and report the result by selecting the range into which it falls. For this question there are seven ranges specified by ASIC. All ranges (except the top) have both minimum and maximum amounts. For the purposes of this analysis I have taken a conservative approach and used the bottom of the range. For example, where 2,473 companies are reported to have an estimated deficiencies in the range $50,001 to $250,000, I have used a total deficiency for that range of $123,652,473, i.e., 2,473 by $50,001. The same principal has been applied throughout my calculations. The total estimated deficiency in this chart is, therefore, the minimum or bottom of the range.

Of its compilation reports  – the latest of which is Report 372 – ASIC says they have been “compiled from the estimates and opinions contained in statutory reports lodged with ASIC by liquidators, receivers and voluntary administrators (external administrators’ reports) in the format of Schedule B to Regulatory Guide 16 External administrators: Reporting and lodging (RG 16) (Schedule B report).”

In its Disclaimer ASIC says: “In compiling the statistics in this report, ASIC has relied on the information in the external administrators’ reports lodged electronically with ASIC. Other than as discussed in Section B of this report, ASIC has not verified or sought to confirm the accuracy of any information in the external administrators’ reports lodged electronically. Accordingly, the statistics in this report cannot be construed or relied on as representing a complete and accurate depiction or statement about the matters or events to which the statistics relate.”

May 142013
 

According to a recent study, the cost of being an official liquidator can be a bit rich.

“In respect of official liquidations generally, the survey showed that on an annual basis, insolvency practitioners are required to personally fund disbursements of $1.4 million and remuneration of $47.3 million in the conduct of their roles as Official Liquidators.”

 This is one of findings in a research paper titled “An Analysis of Official Liquidations In Australia”, written by Amanda Phillips of Ferrier Hodgson, Sydney, and published on 13 May 2013 via the website of the Insolvency Practitioners Association of Australia (IPAA).

More detail of the estimates on annual remuneration and disbursements for official liquidations generally is shown in this table:

Charge made/cost incurred (million dollars)

Recovered from company assets (million dollars)

Funded by Official Liquidators (million dollars)

Remuneration

55.6

8.3

47.3

Disbursements

1.9

.5

1.4

Another finding is that “based on the data provided by survey respondents, the average cost to administer an official liquidation is $17,475 over an average period of 7 to 12 months.”

Ms Phillips surveyed members of the IPAA.  The survey covered official liquidations which commenced during the period 1 July 2011 to 30 September 2011.  The paper says that “Sixteen Official Liquidators provided data in relation to 90 matters, which represented 10% of the total national official liquidations that commenced during the period 1 July 2011 to 30 September 2011.”

In addition to remuneration the paper reports on aspects of official liquidation including the nature of a typical official liquidation, the duration of appointments, an industry analysis, the turnover & size, the dividends to unsecured creditors and funding for Official Liquidators.

Ms Phillips was the 2012 winner of a scholarship from the Terry Taylor Scholarship fund administered by the IPAA.  Her 33 page paper is available in pdf format from the IPAA site by clicking HERE.

Is Bureau of Statistics missing insolvency crimes?

 Insolvency Statistics, Offences, Standards, White collar crime  Comments Off on Is Bureau of Statistics missing insolvency crimes?
Jun 022011
 

The Australian Bureau of Statistics (ABS) has just published the latest edition of Australian and New Zealand Standard Offence Classification (ANZSOC) with the aim of improving crime and justice statistics.  It is a detailed document , comprising 108 pages plus 66 pages of appendices and indexes. 

Crimes listed in the huge alphabetical and numerical indexes of categories of crimes include “Killing, unlawful, with intent” (0111),  “Tram fare evasion” (0829),  “Skateboard riding under the influence of alcohol” (0411) and “Fail to sound audible warning of intended blasting” (1629).

 I have searched in vain for any mention of bankruptcy offences or corporate insolvency offences.  The nearest categories I could find that might apply to corporate insolvency offences were “Breach of company code legislation (e.g. falsification of register, false advertising)” and “Fraudulent trade or commercial practices”.  Both are listed under Division 09 “Fraud, Deception and Related Offences”, in sub-division 093 “Deceptive business/government practices”.

It’s interesting to see the number of offences that warrant special mention, when none is given to, for example, a director’s breach of the law in failing to assist his or her company’s liquidator – which carries a maximum penalty of a fine of $2,750 and imprisonment for 6 months.  What does this say about society’s view of what is a crime, and the thoroughness of the way in which we collect and publish crime statistics?

To see the ANZSOC  document click here.