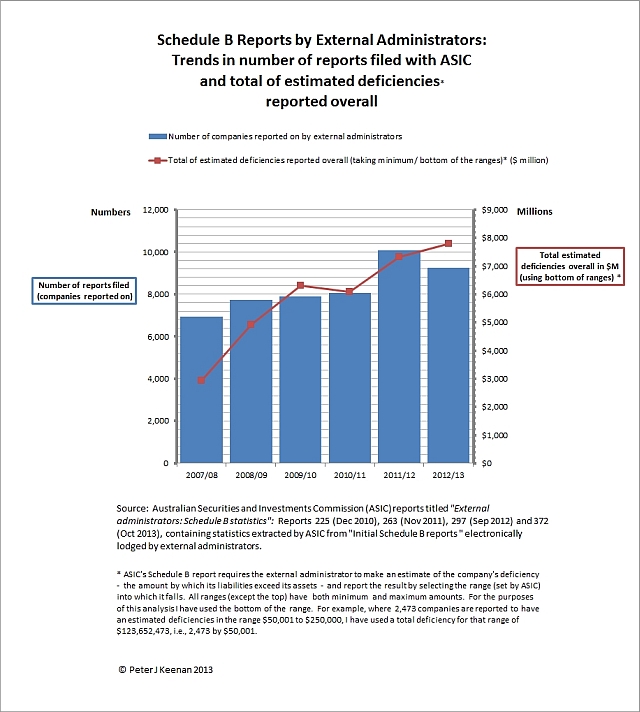
This chart, prepared exclusively for this blog, shows the trend in the number of Schedule B investigation reports filed with the Australian Securities and Investments Commission (ASIC) by external administrators of insolvent corporations from 2007/08 to 2012/13 and the trend in the estimated minimum deficiency that all these corporations, taken together, are said to have incurred.
The primary data has been published by ASIC in annual reports titled, “Insolvency statistics: External administrators’ reports”.
My analysis shows that during 2012/13 the external administrators who filed Schedule B reports electronically reported deficiencies which, taken together, total an estimated minimum of $7.8 billion spread over 9,254 companies. This compares with deficiencies totalling at least $7.3 billion spread over 10,074 companies in 2011/12, and deficiencies totalling at least $6.1 billion spread over 8,054 companies in 2010/11. A deficiency is the amount by which liabilities owing by a company exceeds the value of its assets. In other words, it is the amount that creditors are expected to lose.
When completing the initial external administrator report (Schedule B), the external administrator selects from a predetermined set of options for qualitative questions, and ranges for quantitative questions. There are over 30 questions on the form.
One of those questions requires the external administrator to make an estimate of the company’s deficiency and report the result by selecting the range into which it falls. For this question there are seven ranges specified by ASIC. All ranges (except the top) have both minimum and maximum amounts. For the purposes of this analysis I have taken a conservative approach and used the bottom of the range. For example, where 2,473 companies are reported to have an estimated deficiencies in the range $50,001 to $250,000, I have used a total deficiency for that range of $123,652,473, i.e., 2,473 by $50,001. The same principal has been applied throughout my calculations. The total estimated deficiency in this chart is, therefore, the minimum or bottom of the range.
Of its compilation reports – the latest of which is Report 372 – ASIC says they have been “compiled from the estimates and opinions contained in statutory reports lodged with ASIC by liquidators, receivers and voluntary administrators (external administrators’ reports) in the format of Schedule B to Regulatory Guide 16 External administrators: Reporting and lodging (RG 16) (Schedule B report).”
In its Disclaimer ASIC says: “In compiling the statistics in this report, ASIC has relied on the information in the external administrators’ reports lodged electronically with ASIC. Other than as discussed in Section B of this report, ASIC has not verified or sought to confirm the accuracy of any information in the external administrators’ reports lodged electronically. Accordingly, the statistics in this report cannot be construed or relied on as representing a complete and accurate depiction or statement about the matters or events to which the statistics relate.”
